Overview
React Chart JS is a library for creating charts and graphs in React applications using the Chart.js library. It provides React components that allow developers to easily integrate and customize charts in their applications.
Documentation
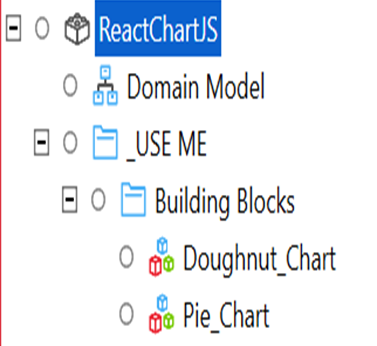
React Chart JS library widget
React Chart JS is a library for React Chart JS library widget charts and graphs in React applications using the Chart.js library. It provides React components that allow developers to easily integrate and customize charts in their applications.
Some of the main features and advantages of React Chart JS include:
-
Easy to use : React Chart JS provides React components that make it easy to create and customize charts without having to write a lot of code.
-
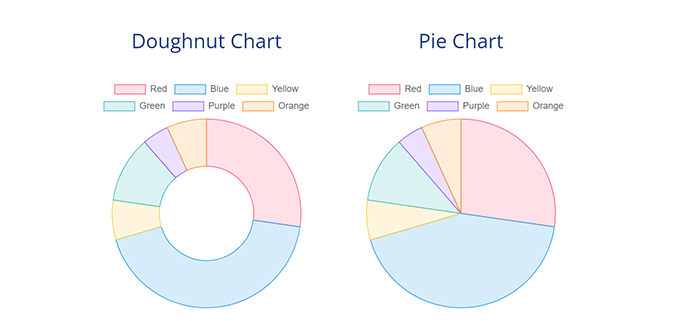
Wide range of chart types : React Chart JS supports a wide range of chart types, including line, bar, pie, doughnut, and more.
-
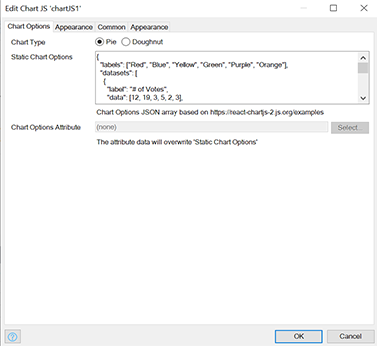
Highly customizable : React Chart JS provides a variety of options and configurations for customizing the appearance and behaviour of charts.
-
Responsive design : React Chart JS charts are designed to be responsive and work well on a variety of devices and screen sizes.
-
Integrates with React : React Chart JS is designed to work seamlessly with React, making it easy to integrate charts into React applications.
-
Open source : React Chart JS is open-source software, which means that it is free to use and can be modified and improved by developers.
Overall, React Chart JS is a powerful and flexible tool for creating charts and graphs in applications. Whether you need to display data in a simple bar chart or create a complex dashboard with multiple charts, React Chart JS provides the tools you need to create high-quality, interactive visualizations.
Check Documentations in this link: https://shrturl.app/0GT2jZ and https://www.chartjs.org/
Check examples in this link: https://shrturl.app/_973NI