Overview
Integrating a donut chart with Mendix can be done through a pluggable widget. A pluggable widget is a reusable component that can be added to a Mendix application to add custom functionality or user interface elements.
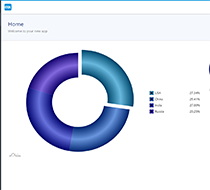
A donut chart is a type of chart that is similar to a pie chart but has a hole in the center. The chart is divided into sections, or slices, that represent different categories or values. The size of each slice represents the proportion of the whole that it represents.
Documentation
Description
Integrating a donut chart with Mendix can be done through a pluggable widget. A pluggable widget is a reusable component that can be added to a Mendix application to add custom functionality or user interface elements.
A donut chart is a type of chart that is similar to a pie chart but has a hole in the center. The chart is divided into sections, or slices, that represent different categories or values. The size of each slice represents the proportion of the whole that it represents.
Features
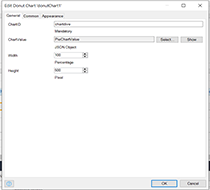
- Allows you to pass custom variables are Chart id (Mandatory),ChartValue, Width and Height.
- Define the input parameters that the widget will use to receive JSON data and settings for the chart. These parameters can include in the data source.
Usage
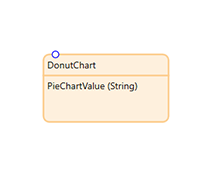
Insert the widget into any layout where you want to include a DonutChart
We must configure the chartID and ChartValue.
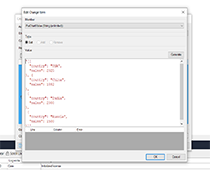
Insert "DSMicroflow" and pass the JSON object to show the Donutchart.
Find the below attached screenshots
Issues, suggestions, and feature requests
https://github.com/bharathidas/Native-Words-Highilighter/issues